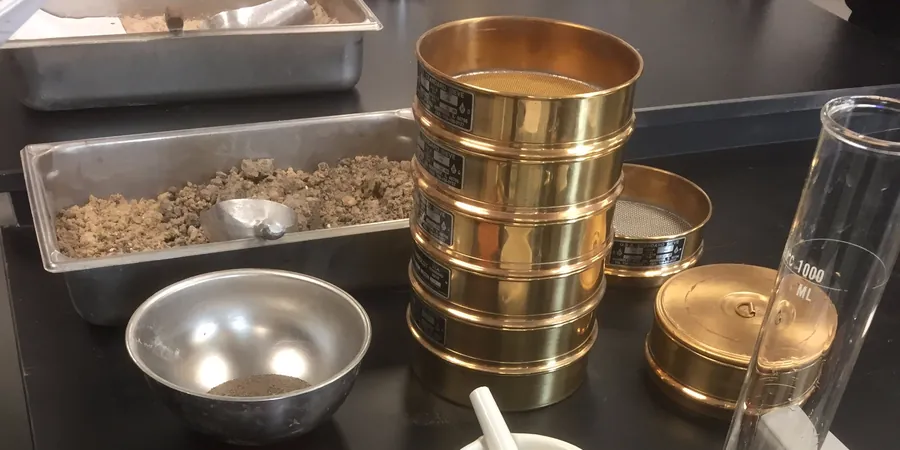
The stack of 8-inch brass sieves sits on our Ro-Tap shaker, each pan nested tight. The top sieve catches the gravel; the No. 200 pan collects the silt wash. In Oakville, a sample from the Halton Till—grey, stony, matrix-supported—runs through this column first dry, then wet. We oven-dry every fraction. Then the minus-75-micron portion moves to a sedimentation cylinder. Hydrometer readings start at two minutes. The technician logs temperature, meniscus correction, and suspension density. With 213,000 people living above the shale bedrock of the Queenston Formation, the grain size distribution controls how water moves through foundation subgrades. A poorly graded sand drains fast; a gap-graded glacial till traps water and freezes hard. The Atterberg limits bench runs parallel on the fines fraction, tying plasticity to the silt-clay ratio we measure here.
The coefficient of uniformity on an Oakville till can exceed 40—that wide gradation compacts tight but drains slow. The hydrometer tells us how much clay is driving that behaviour.
Methodology and scope
Local considerations
Winter in Oakville means frost penetrating the moist silty subgrades. If the hydrometer shows more than 10 percent fines passing the 75-micron sieve, that soil is frost-susceptible. Pavements heave. Foundations shift. We have seen gap-graded Halton Till where the sand skeleton holds up well in summer but the silt pockets saturate in November and freeze solid by January. The grain size curve tells the full story. A steep slope on the curve means uniformity—poorly graded, likely to densify under vibration. A flat curve across three log cycles means a well-graded mixture that compacts to high density but needs careful moisture control. For stormwater infiltration trenches near the Lake Ontario shoreline, the D15 and D85 values from this test drive the filter compatibility check with the surrounding native soil.
Applicable standards
ASTM D6913-04 (2021) — Particle-Size Distribution of Soils Using Sieve Analysis, ASTM D7928-21 — Particle-Size Distribution of Fine-Grained Soils Using the Sedimentation (Hydrometer) Analysis, OPSS 1010 — Material Specification for Aggregates (Ontario Provincial Standard)
Associated technical services
Wash Sieve Analysis (Coarse + Fine)
Mechanical dry sieving followed by washing over the No. 200 sieve. We dry and weigh every retained fraction. Suitable for sands, gravelly tills, and crushed aggregates.
Hydrometer Sedimentation Test
ASTM D7928 procedure on the minus-75-micron material. Readings at 2, 5, 15, 30, 60, 250, and 1440 minutes. We report the full silt and clay distribution curve.
Full Gradation Report with Coefficients
Combined plot with D-values, Cu, Cc, and USCS classification. We include percent gravel, sand, silt, and clay fractions and the soil description per ASTM D2487.
Typical parameters
Frequently asked questions
How much does a grain size analysis (sieve plus hydrometer) cost in Oakville?
For a standard combined test on one sample, the fee ranges from CA$120 to CA$220 depending on whether we run only the wash sieve or the full sedimentation hydrometer as well. Soils with high clay content require longer hydrometer runs, which affects the lab time.
Which Oakville soils need the hydrometer, and can we skip it?
If the wash over the No. 200 sieve shows more than about 12 percent passing, the hydrometer is worth running. The Halton Till matrix often holds 20 to 40 percent fines. Skipping the sedimentation test leaves you blind on the silt-to-clay ratio, which controls frost susceptibility and drainage behaviour.
What is the typical turnaround time for a full particle size distribution?
The sieve portion finishes the same day. The hydrometer requires overnight sedimentation readings, plus cylinder calibration. Standard turnaround is two to three working days. We can expedite for urgent construction submittals.